
Hydrodynamic response of a floating offshore wind turbine (1st FOWT Comparative Study)
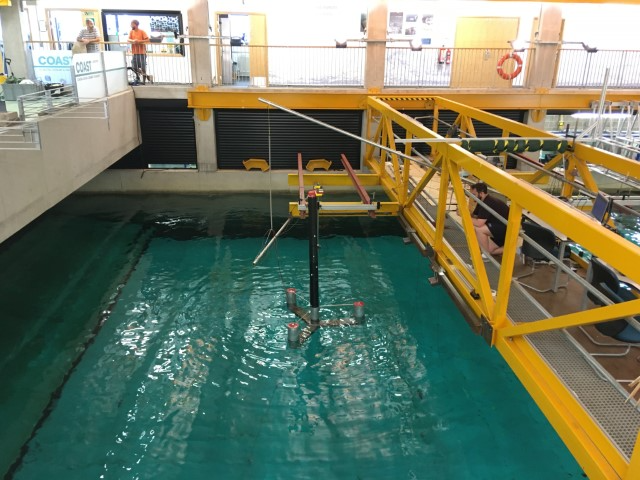
These test cases consider the hydrostatic and hydrodynamic response of a 1:70 scale model of the IEA 15MW reference
wind turbine (IEA-15-240-RWT) (Gaertner, et al. 2020) and
UMaine VolturnUS-S semi-submersible platform (Allen, et
al. 2020).
The test cases consist of static equilibrium load cases, free decay tests (in heave, surge and pitch)
and
a pair of focused wave cases (one ‘operational’ and one ‘extreme’).
Note: only hydrodynamic loading is considered in
this comparative study, i.e. there is no aerodynamic loading on the floating offshore wind turbine (FOWT).
Date of Experiment
Facility (for Physical Test Cases)
- COAST
Contributors
- Ed RansleyUniversity of Plymouth

Description
These test cases consider the hydrostatic and hydrodynamic response of a 1:70 scale model of the IEA 15MW reference
wind turbine (IEA-15-240-RWT) (Gaertner, et al. 2020) and
UMaine VolturnUS-S semi-submersible platform (Allen, et
al. 2020).
The test cases consist of static equilibrium load cases, free decay tests (in heave, surge and pitch)
and
a pair of focused wave cases (one ‘operational’ and one ‘extreme’).
Note: only hydrodynamic loading is considered in
this comparative study, i.e. there is no aerodynamic loading on the floating offshore wind turbine (FOWT).
Experimental Set-up
Experiments were performed in the COAST Laboratory Ocean Basin (35m long X 15.5m width) at the University of
Plymouth, UK. The basin has 24 flap-type, force feedback controlled wave makers with a hinge depth of 2m. The water
depth at the wave makers is 4m and there is a linear slope to the working area where the water depth, h, was
set to
2.86m. At the far end of the basin there is a parabolic absorbing beach (Figure 1).
The water in the basin is ‘fresh’ water (approximate density, ρ = 998.2072 kg/m3 and viscosity, μ = 0.001002
Pa·s [at 20°C]).
The global coordinate system is defined with the z-axis running vertically (positive z upwards) with z = 0
corresponding to the still water level. The x-axis runs in the direction of wave propagation (from the wave makers
to the beach). The y-axis is defined according to the right-hand-rule. The origin of the global coordinate system is
located 17.3m downstream of the wave makers (near the centre of the device when at rest with no environmental
loading) (Figure 1).
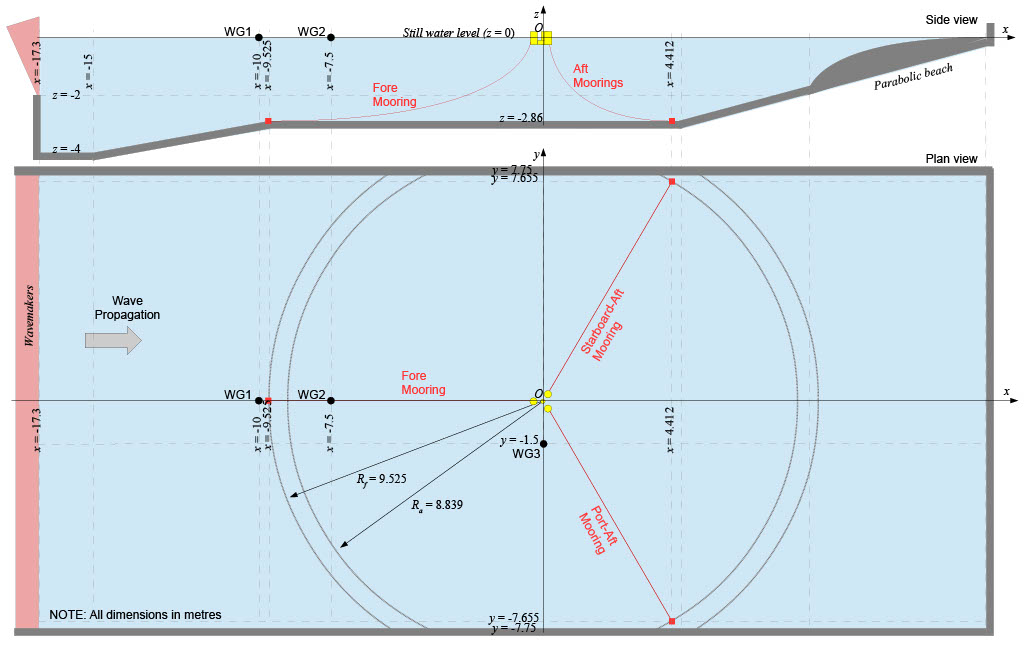
coordinate system
Experimental Layout
A plan view of the experimental layout is presented in Figure 1. The locations of the wave gauges (WG) and mooring
anchors (in the global coordinate system) are indicated by the black circles and red squares respectively, and given
in Table 1. The fore mooring anchor is located at the start of the working region of the Ocean Basin. The 3 mooring
lines, and their reference names, are indicated with red lines/text. The anchor radii are indicated by dotted arcs
(NOTE: unlike the reference document for the VolturnUS-S (Allen,
et al. 2020), the fore and aft moorings have
different anchor radii since they are truncated to fit in the basin [further information can be found in the mooring
description below]).
| WG1 | WG2 | WG3 | Fore anchor | Starboard-Aft anchor | Port-aft anchor | |
|---|---|---|---|---|---|---|
| x coordinate | -10.0 | -7.5 | 0.0 | -9.525 | 4.412 | 4.412 |
| y coordinate | 0.0 | 0.0 | -1.5 | 0.0 | 7.655 | -7.655 |
| z coordinate | – | – | – | -2.86 | -2.86 | -2.86 |
Scaled Model
The device considered in these tests is a 1:70 scale model of the IEA Wind 15-Megawatt Offshore Reference Wind
Turbine (IEA-15-240-RWT) (Gaertner, et al. 2020) mounted
on the UMaine VolturnUS-S semi-submersible platform (Allen,
et al. 2020). NOTE: The geometry of the scale model differs slightly compared to a true scaled-version of
the
references and the mass properties have been adjusted to retain approximately the correctly scaled reference draft,
i.e. 20m at full-scale, in the fresh water basin. The geometry of the rotor-nacelle-assembly (RNA) has not been
modelled precisely (as, in cases with wind, the aerodynamic loading on the turbine is included using a hybrid
testing system consisting of two on-board drone propellers). Figure 2 shows the key dimensions of the device and the
positions of the centre of mass and mooring fairleads in the body-fixed coordinate system. The body-fixed coordinate
system is defined with the model upright, i.e. the axis of the tower vertically upwards, the x-axis parallel to a
vector from the fore fairlead to the tower axis and the origin at the base of the platform (see Figure 2). The key
dimensions of the device and the definition for the body-fixed coordinate system are provided in Figure 2 and
summarised, along with the mass properties of the model, in Table 2.
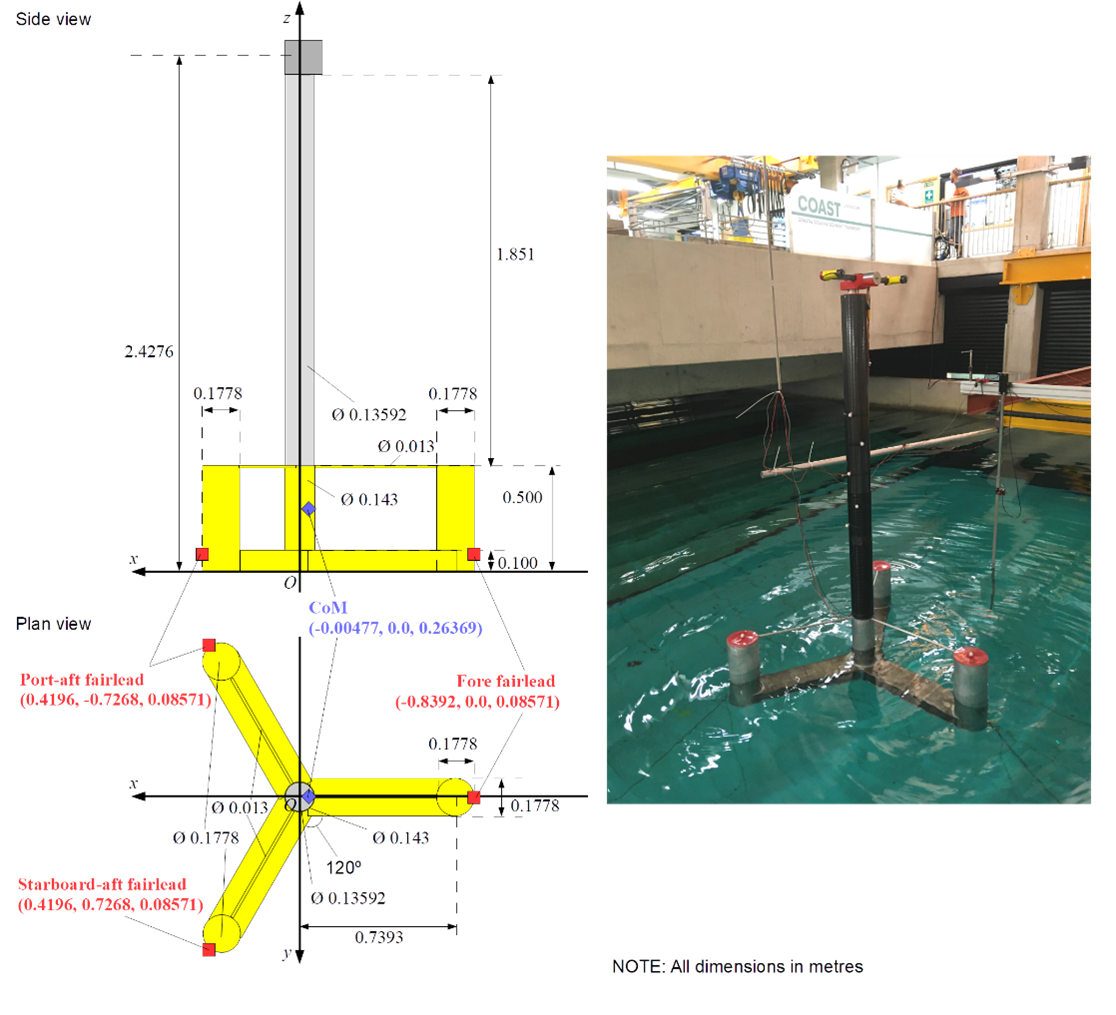
mooring fairleads (in body-fixed system)
| Model values | |
|---|---|
| Diameter of central column [m] | 0.143 |
| Diameter of outer columns [m] | 0.1778 |
| Height of columns [m] | 0.500 |
| Distance between central and outer column axes | 0.7393 |
| Width of pontoons [m] | 0.1778 |
| Depth of pontoons [m] | 0.100 |
| Mass [kg] | 56.3 |
| CoM position (x, y, z) coordinate [m] | (-0.00477, 0.0, 0.26369) |
| Ixx [kg m2] | 26.68 |
| Iyy [kg m2] | 26.68 |
| Izz [kg m2] | 14.18 |
| Fore fairlead position (x, y, z) coordinate [m] | (-0.8392, 0.0, 0.08571) |
| Aft-Port fairlead position (x, y, z) coordinate [m] | (0.4196, -0.7268, 0.08571) |
| Aft-Starboard fairlead position (x, y, z) coordinate [m] | (0.4196, 0.7268, 0.08571) |
Mooring Description
The device is kept on station using a three point mooring system constructed from ‘3mm long link’ stainless chain.
Some links were added in parallel to the chain to achieve the correctly scaled dry line linear density. Due to the finite
width of the working region, the laboratory moorings had to be truncated to fit the Ocean Basin. Key details on the
mooring properties are given in Table 3 (see Tables 1 and 2 for the anchor and fairlead positions respectively).
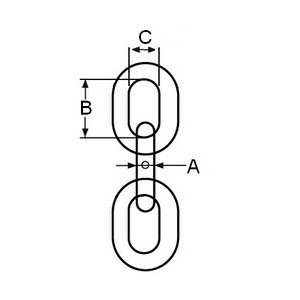
| Model values | |
|---|---|
| Fore mooring length [m] | 9.685 |
| Aft-starboard mooring length [m] | 9.017 |
| Aft-Port mooring length [m] | 9.017 |
| Dry mass/length [kg/m] | 0.144 |
| Bar diameter (A in Figure 3) [m] | 0.00282 |
| B in Figure 3 [m] | 0.0263 |
| C in Figure 3 [m] | 0.0065 |
| Submerged mass/length [kg/m] (0.872 * dry density) | 0.125568 |
Thruster Cable Bundle Description
The thruster cables were not attached for these tests.
Experimental Test Program
For the physical model, and set-up, described above, a number of ‘load cases’ are considered in this comparative
study. Initially static equilibrium is considered (both with and without the moorings attached). Due to the
complexity of the model/system, particularly the off-centre CoM, these equilibrium cases are deemed necessary to
ascertain the equilibrium position/orientation of the model in advance of the dynamic load cases. There are then a
series of decay tests considering the heave, surge and pitch degrees of freedom. Finally there are a pair of focused
wave interactions with the moored floating structure.
Static Equilibrium
Measurements have been taken with the model at rest. Initially, such a ‘static equilibrium’ test has been conducted
without the mooring system attached (to reduce uncertainty associated with the mooring system parameters/modelling).
Then another static equilibrium test has been performed with the moorings attached. For these cases, the position of
the centre of mass (in the global coordinate system) and the pitch angle of the model (about the centre of mass) are
given in Table 4. For the case with the moorings attached, Table 4 also gives the measured positions of the mooring
fairleads (in the global coordinate system) and the measured mooring line tensions (at the fairleads) for the
equilibrium position.
| No moorings | With moorings | |
|---|---|---|
| FOWT Comparative Study ID | FOWT1_EQ_unmoored | FOWT1_EQ_moored |
| Equilibrium CoM position [m] | (-0.00477\*, 0.0\*, -0.00126) | (-0.02038, 0.0, -0.02386) |
| Equilibrium pitch angle about CoM [°] | -1.729 | -1.502 |
| Fore fairlead position (x, y, z) coordinate [m] | n/a | (-0.84956, 0.0, -0.22338) |
| Aft-Port fairlead position (x, y, z) coordinate [m] | n/a | (0.40880, -0.7268, -0.19065) |
| Aft-Starboard fairlead position (x, y, z) coordinate [m] | n/a | (0.40880, 0.7268, -0.19065) |
| Fore mooring line tension (at fairlead) [N] | n/a | 7.6 |
| Aft-Port moorting line tension (at fairlead) [N] | n/a | 7.2 |
| Aft-Starboard mooring line tension (at fairlead) [N] | n/a | 7.2 |
\*values somewhat arbitrary for the unmoored case
Decay tests
The next set of load cases consider decay tests in the three principle degrees of freedom (heave, surge and pitch).
Due to the coupled nature of the system no degrees of freedom can be considered in isolation but each decay test is
identified by the primary degree of freedom, i.e. the one with the greatest offset from equilibrium.
For each decay test, Table 5 provides the initial vertical/z offset of the centre of mass, the initial horizontal/x
offset of the centre of mass and the initial pitch offset about the centre of mass. NOTE: values in Table 5 are
offsets relative to the equilibrium position/orientation of the device (with moorings) and it is requested that
participants in the Comparative Study perform these decay tests using these offsets relative to their equilibrium
position/orientation found in the static equilibrium load case described above. Furthermore, the offsets in the other degrees of freedom have been omitted from Table 5 as, for simplicity, we suggest participants assume these are zero (the true offset in these other degrees of freedom can be found from the physical data if necessary).
| Heavy Decay | Surge Decay | Pitch Decay | |
|---|---|---|---|
| FOWT Comparative Study ID | FOWT1_Decay_heave | FOWT1_Decay_surge | FOWT1_Decay_pitch |
| Original ID\* | Heavy_decay_ABP1_3 | Surge_decay_Thrlt2_NC_1 | Pitch_decay_AW2_2 |
| Initial z offset [m] | -0.1472 | -0.0017 | -0.0277 |
| Initial x offset [m] | -0.0149 | 0.3825 | -0.0031 |
| Initial pitch offset [°] | 0.4719 | -0.7657 | -9.7980 |
\*for administration only
Focused wave cases
The final load cases in the 1st FOWT Comparative Study consist of a pair of focused wave interactions with the FOWT.
The waves are generated using the EDL wave synthesiser and paddle control software. The displacement of the paddles
is calculated using linear wave maker theory. 112 ‘fronts’ (components) evenly spaced between frequencies of 0.15
and 2Hz (spacing = 0.05/3 Hz) are supply to the paddle control software based on a theoretical wave description. In
these cases, the theoretical wave descriptions are crest-focused (i.e. zero phase at focus location,
xfocus, at the
focus time, φfocus) NewWaves based on the 50 year conditions in the Gulf of Maine (NOAA 44005) and a
Pierson-Moskowtiz spectrum. The two waves have similar steepness but vary in terms of the peak frequency,
Tp, and
the significant wave height, Hs. Both wave cases have a theoretical focus time, tfocus = 50s, and a
theoretical
focus location in the global coordinate system, xfocus = 0m, i.e. 17.3m upstream of the wavemakers. The
crest
amplitude, Acr, for the two wave cases has been calculated according to \(A_{cr}=\sqrt{2m_0\ln1000}\), where m0
is the
zeroth spectral moment and can be approximated according to \(m_0=\left(\frac{H_s}{4}\right)^2\). Table 6 summarises the theoretical
parameters in the wave descriptions used for wave generation in two wave cases. A file containing the parameters
describing the 112 fronts in each case (e.g. FOWT1_FW1_fronts.txt) can be found in the ‘Resources’ section below.
| FOWT Comparative Study ID | FOWT1_FW1 | FOWT1_FW2 |
|---|---|---|
| Original ID\* | Benign_Focus_0deg_ThrusterIter2_3 | Extreme_Focus_0deg_ThrusterIter2_3 |
| Water depth [m] | 2.86 | 2.86 |
| Theoretical peak period, Tp [s] | 1.3831 | 1.9380 |
| Theoretical significant wave height, Hs [m] | 0.069 | 0.139 |
| Theoretical crest elevation, Acr [m] | 0.064 | 0.127 |
| Theoretical focus location, xfocus [m]\*\* | 0.0 | 0.0 |
| Theoretical focus time, tfocus [s] | 50 | 50 |
| Theoretical focus phase, φfocus [°] | 0 | 0 |
\*for administration only
\*\*NOTE: xfocus given in global coordinate system
As well as the information about the fronts used in the wave generation, an empty tank test (i.e. without the device
present) was performed for each of the wave cases. The surface elevation, in these empty tank tests, measured at the
positions in Table 7 are available in the ‘Resources’ section below (e.g. FOWT1_FW1_empty.txt)
| WG1 | WG2 | WG3 | WG4 | WG5 | WG6 | WG7 | WG8 | WG9 | |
|---|---|---|---|---|---|---|---|---|---|
| x coordinate | -10.0 | -7.5 | 0.0 | -0.4 | -0.2 | 0 | 0.2 | 0.4 | 0.75 |
| y coordinate | 0.0 | 0.0 | -1.5 | 0 | 0 | 0 | 0 | 0 | 0 |
These wave cases were then repeated with the FOWT initially at rest, in its equilibrium position.
Physical Measurement Data
The 1st FOWT Comparative Study has now ended. The experimental data associated with the study can be found in Ransley et a. 2022 . The data files are organised as follows:
Decay tests
For the decay tests, the experimental data is provided in an individual text file for each of the cases and is
arranged as follows:
- The text files FOWT1_Decay_heave_Experiment.txt; FOWT1_Decay_surge_Experiment.txt, and;
FOWT1_Decay_pitch_Experiment.txt contain time series data for the motion and mooring load the three decay tests
(FOWT1_Decay_heave; FOWT1_Decay_surge, and FOWT1_Decay_pitch respectively). - In each file, the first row is a header row (incl. units) and begins with a ‘%’ for (MATLAB) post-processing
purposes. From the second row onwards is the time series data - Column 1 of the data is the time, in seconds, since the release of the structure.
- Columns 2-4 are the x, y and z positions, respectively, of the structure’s centre of mass, in the global
coordinate system, in metres. - Columns 5-7 are the rotational displacements of the structure, in degrees, about the body-fixed x, y and z
axes (i.e. roll, pitch and yaw) respectively (using the ‘right-hand rule’). - Columns 8-10 are the mooring line tensions, in Newtons, at the fairlead position of the fore, port and
starboard mooring respectively. The mooring load measurements have been filtered using a zero-phase digital
filter based on a twelfth-order low pass IIR Butterworth filter with a normalised 3-dB frequency of 0.005π
rad/sample. The mooring load measurements have also been interpolated onto the same time vector as the
position/orientation measurements. [NOTE: the starboard mooring data has been omitted due to an issue with the
load cell output]
Focused wave cases – incl. the FOWT
For the focused wave cases (including the FOWT), the experimental data is provided in an individual text file for
each of the cases and is arranged as follows:
- The text files FOWT1_FW1_Experiment.txt, and; FOWT1_FW2_Experiment.txt, contain time series data for the
motion, mooring load and surface elevation measurements for the two focused wave cases (FOWT1_FW1, and FOWT1_FW2
respectively). - In each file, the first row is a header row (incl. units) and begins with a ‘%’ for (MATLAB) post-processing
purposes. From the second row onwards is the time series data - Column 1 of the data is the time, in seconds, with time = 0s corresponding to the start time of the wave
makers. - Columns 2-4 are the x, y and z positions, respectively, of the structure’s centre of mass, in the global
coordinate system, in metres. - Columns 5-7 are the rotational displacements of the structure, in degrees, about the body-fixed x, y and z
axes (i.e. roll, pitch and yaw) respectively (using the ‘right-hand rule’). - Columns 8-10 are the mooring line tensions, in Newtons, at the fairlead position of the fore, port and
starboard mooring respectively. The mooring load measurements have been filtered using a zero-phase digital
filter based on a twelfth-order low pass IIR Butterworth filter with a normalised 3-dB frequency of 0.005π
rad/sample. The mooring load measurements have also been interpolated onto the same time vector as the
position/orientation measurements. [NOTE: the starboard mooring data has been omitted due to an issue with the
load cell output] - Columns 11-13 are the surface elevation measurements, in metres, at WG1, WG2 and WG3 (Figure 1)
respectively.
Blind Test
Submission Procedure
The 1st FOWT Comparative Study has now ended; we are no longer accepting submissions.
<!—
To participate in the 1st FOWT Comparative Study we kindly ask participants to submit their simulation
data based on
the following submission procedure. The 1st FOWT Comparative Study is an ‘open’ comparative study, i.e.
the physical
measurements for the test cases are available so participants have the opportunity to compare their results with the
experiments in order to help identify potential problems in the numerical implementation etc.
Schedule
The 1st FOWT Comparative Study is being run in conjunction with the ISOPE 2023 conference and the findings of the
Study will be presented during a special session at ISOPE 2023. We are presently limiting participation, and release
of the physical data, to those contributing to the ISOPE 2023 technical programme, i.e. those submitting papers and
presenting their results at ISOPE 2023 (all data will be made publicly available shortly after the Study is
complete). It is our intention to contribute to a feature issue of the International Journal of Offshore and Polar
Engineering with the papers corresponding to the individual contributions from the participants and a main paper
detailing the main findings from the Comparative Study (but individual contribution to the IJOPE feature issue is
not mandatory for participation in the Comparative Study). Please note, all participants in the 1st FOWT Comparative
Study will be included as co-authors on the main paper. As a result, the schedule follows the schedule of the ISOPE
2023 as below:
| 19th Oct. 2022 | Release of the 1st FOWT Comparative Study description (official start of the Study) |
| 31st Oct. 2022 | ISOPE abstract deadline and EoI sent to Edward.ransley@plymouth.ac.uk and L.Qian@mmu.ac.uk * |
| 20th Jan. 2023 | ISOPE manuscript (for review) deadline |
| 30th Mar. 2023 | ISOPE manuscript final deadline |
| 30th Mar. 2023 | Deadline for submission of numerical solutions to the Comparative Study |
| 19-23 June 2023 | 1st FOWT Comparative Study special session at ISOPE 2023, Ottawa, Canada |
| 31st Aug. 2023 | (proposed) Submission of papers (for review) to IJOPE feature issue** |
| 31st Oct. 2023 | (proposed) Final submission of papers to IJOPE feature issue* |
| 31st Oct. 2023 | Public release of all test case data (official close of the Comparative Study) |
\*physical measurement data will be supplied to those who have submitted an ISOPE abstract and sent an EoI
\*\*individual contribution to the IJOPE feature issue is not mandatory for participation in the 1st FOWT Comparative
Study
Static equilibrium
It is requested that each participant first simulate the FOWT in still water, both with and without the mooring
included, until static equilibrium is reached. The information given in Table 4 can be used to position the FOWT
close to equilibrium at the beginning of the simulation, however, it should be noted that the mass properties given
in Table 2 are given in the body-fixed coordinate system and will need transformation to begin from a rotated
position. Alternatively, participants can begin the static equilibrium simulations with the model/tower vertical,
however due to relatively low pitch damping the required simulation length is >60s.
For the static equilibrium cases, it is requested that time series data be submitted for the six degrees of freedom
motion of the FOWT and the mooring line tensions at the fairleads (in the moored case). For the unmoored static
equilibrium case, please submit:
- A single, tab-delimited text file:
- filename: FOWT1_EQ_unmoored_{institution} (e.g. FOWT1_EQ_unmoored_Plymouth)
- column 1: Time (in secs, i.e. 0 – 60s, please simulate as much time as necessary)
- column 2: Horizontal/x-coordinate (surge) of the CoM, in metres, in global coordinate system
- column 3: Horizontal/y-coordinate (sway) of the CoM, in metres, in global coordinate system
- column 4: Vertical/z-coordinate (heave) of the CoM, in metres, in global coordinate system
- column 5: Roll about CoM, in degrees, relative to upright position, i.e. with tower vertical
- column 6: Pitch about CoM, in degrees, relative to upright position, i.e. with tower vertical
- column 7: Yaw about CoM, in degrees, relative to upright position, i.e. with tower vertical
For the moored static equilibrium case, please submit:
- A single, tab-delimited text file:
- filename: FOWT1_EQ_moored_{institution} (e.g. FOWT1_EQ_unmoored_Plymouth)
- columns 1-7: Same as for unmoored case above
- columns 8-10: Tension in fore, port and starboard fairleads respectively, in N
Decay tests
As described above, it is requested that each of the decay tests be performed by applying the offsets in Table 5 to
the moored equilibrium position/orientation found in the static equilibrium test (described above) [NOTE: roll, sway
and yaw are assumed to be zero at time = 0]. Again, please note that the mass properties of the device, given in
Table 2, will need to be transformed according to the initial position/orientation of the FOWT.
For each of the decay tests (heave, surge and pitch) it is requested that time series data be submitted for the six
degrees of freedom motion of the FOWT and the mooring line tensions at the fairleads. For the analysis we request at
least 180s be simulated in each case (but the more time the better) with time = 0s as the ‘release’ time of the
FOWT. For decay test, please submit:
- A single, tab-delimited text file
- filename: FOWT1_Decay_{primaryDOF}_{institution} (e.g. FOWT1_Decay_heave_Plymouth)
- column 1: Time (in secs, i.e. 0 – 180s, please simulate as much time as you can)
- column 2: Horizontal/x-coordinate (surge) of the CoM, in metres, in global coordinate system
- column 3: Horizontal/y-coordinate (sway) of the CoM, in metres, in global coordinate system
- column 4: Vertical/z-coordinate (heave) of the CoM, in metres, in global coordinate system
- column 5: Roll about CoM, in degrees, relative to upright position, i.e. with tower vertical
- column 6: Pitch about CoM, in degrees, relative to upright position, i.e. with tower vertical
- column 7: Yaw about CoM, in degrees, relative tupright position, i.e. with tower vertical
- columns 8-10: Tension in fore, port and starboard fairleads respectively, in N
Focused wave cases – empty tank
It is requested that, for each of the focused wave cases, a corresponding empty tank simulation is also conducted
(with a numerical mesh equivalent to that used in the cases with the structure included) and the data submitted as
part of the Study. NOTE: Please remember that the physical measurements from corresponding empty tank experiments
are available in the ‘Resource’ section.
For the empty tank submissions, it is requested that time series data be submitted for surface elevation recorded at
the positions of wave gauges 1-9 (see Table 7 for WG positions in empty tank). For each empty tank case please
submit:
- A single, tab-delimited text file:
- filename: {caseID}_empty_{institution} (e.g. FOWT1_FW1_empty_Plymouth)
- column 1: Time (in secs relative to beginning of empty tank data, i.e. 0 – 64s)
- columns 2-10: Surface elevation measurements (in metres)
- WG 1, 2, 3, 4, 5, 6, 7, 8, 9
Focused wave cases – incl. the FOWT
For the focused wave cases including the FOWT structure, it is requested that time series data be submitted
according to the following:
- A single, tab-delimited text file:
- filename: {caseID}_{institution} (e.g. FOWT1_FW1_Plymouth)
- column 1: Time (in secs relative to beginning of empty tank data, i.e. 0 – 64s)
- column 2: Horizontal/x-coordinate (surge) of the CoM, in metres, in global coordinate system
- column 3: Horizontal/y-coordinate (sway) of the CoM, in metres, in global coordinate system
- column 4: Vertical/z-coordinate (heave) of the CoM, in metres, in global coordinate system
- column 5: Roll about CoM, in degrees, relative to upright position, i.e. with tower vertical
- column 6: Pitch about CoM, in degrees, relative to upright position, i.e. with tower vertical
- column 7: Yaw about CoM, in degrees, relative to upright position, i.e. with tower vertical
- columns 8-10: Tension in fore, port and starboard fairleads respectively, in N
- columns 11-13: Surface elevation measurements (in metres)
- WG 1, 2, 3
—>
Resources
Accompanying documents
| Filename | Description |
|---|---|
|
FOWT1_FW1_fronts.txt |
Wave fronts supplied to wave maker for wave generation in FOWT1_FW1 (and FOWT1_FW1_empty); tab-delimited text file (lines 1-3 – headers; column 1 – frequency (Hz); column 2 – amplitude (m); column 3 – angle (rad); column 4 – phase (rad) |
|
FOWT1_FW2_fronts.txt |
Wave fronts supplied to wave maker for wave generation in FOWT1_FW2 (and FOWT1_FW2_empty); tab-delimited text file (lines 1-3 – headers; column 1 – frequency (Hz); column 2 – amplitude (m); column 3 – angle (rad); column 4 – phase (rad) |
| FOWT1_FW1_empty.txt |
Empty tank test surface elevation data for FOWT1_FW1 wave case (FOWT1_FW1_empty); tab-delimited text file (line 1 – header; column 1 – Time (s); columns 2-10 – surface elevation at wave gauges WG1-WG9 (m)) |
| FOWT1_FW2_empty.txt |
Empty tank test surface elevation data for FOWT1_FW2 wave case (FOWT1_FW2_empty); tab-delimited text file (line 1 – header; column 1 – Time (s); columns 2-10 – surface elevation at wave gauges WG1-WG9 (m)) |
Relevant References
The details, and all corresponding physical data, for the 1st FOWT Comparative Study are published by the University of Plymouth and deposited in the University of Plymouth Research Repository (under embargo until completion of the 1st FOWT Comparative Study) with the citation and doi:
-
Ransley, E., Brown, S., Edwards, E., Tosdevin, T., Monk, K., Reynolds, A., Greaves, D., Hann, M. (2022). “Hydrodynamic response of a floating offshore wind turbine (1st FOWT Comparative Study Dataset)”. University of Plymouth Research Repository,
https://doi.org/10.24382/71j2-3385
We request that contributions to the 1st FOWT Comparative Study special session at ISOPE 2023 use this as the present source of the test case description and physical data. Once published, citation of the main paper (presenting the findings from the study) will also be expected when using this data.
-
Allen, C., A. Viselli, H. Dagher, A. Goupee, E. Gaertner, N. Abbas, M. Hall, and G. Barter (2020). “Definition
of
the UMaine VolturnUS-S Reference Platform Developed for the IEA Wind 15-Megawatt Offshore Reference Wind
Turbine”.
Golden, CO: National Renewable Energy Laboratory. NREL/TP-5000-76773.
https://www.nrel.gov/docs/fy20osti/76773.pdf -
Gaertner, E., J. Rinker, L. Sethuraman, F. Zahle, B. Anderson, G. Barter, N. Abbas, F. Meng, P. Bortolotti, W.
Skrzypinski, G. Scott, R. Feil, H. Bredmose, K. Dykes, M. Shields, C. Allen, and A. Viselli (2020). “Definition
of the IEA 15-Megawatt Offshore Reference Wind”. Golden, CO: National Renewable Energy Laboratory.
NREL/TP-5000-75698.
https://www.nrel.gov/docs/fy20osti/75698.pdf