Focused wave interactions with a submerged flexible membrane (CCP-WSI Comparative Study 2 [formerly CCP-WSI Blind Test Series 4])
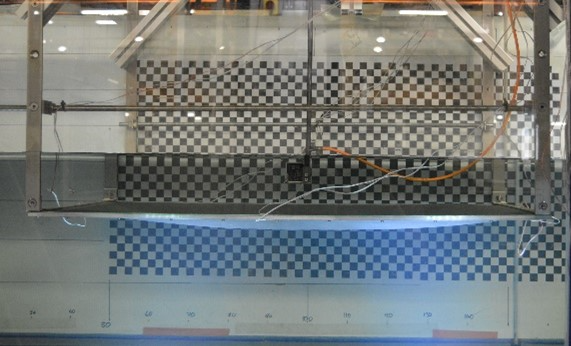
The CCP-WSI Comparative Study 2 (formerly the CCP-WSI Blind Test Series 4) consists of three test cases involving a submerged flexible membrane subject to a focused wave event. In addition to these focused wave cases, there are also a number of additional cases to enable characterisation of the structural properties and the hydrodynamic conditions. These characterisation cases include: empty tank tests, i.e. generation and propagation of the focused wave events in isolation, without the structure present, and; static equilibrium tests, i.e. measurement of the membrane position/shape in equilibrium under the action of gravity (both submerged and subaerial). These test cases, and the experimental data, have been delivered as part of the Flexible Responsive Systems in Wave Energy (FlexWave) project [EP/V040367/1]
Date of Experiment
Facility (for Physical Test Cases)
- COAST
Contributors
- Ed RansleyUniversity of Plymouth

Description
The CCP-WSI Comparative Study 2 (formerly the CCP-WSI Blind Test Series 4) consists of three test cases involving a submerged flexible membrane subject to a focused wave event. In addition to these focused wave cases, there are also a number of additional cases to enable characterisation of the structural properties and the hydrodynamic conditions. These characterisation cases include: empty tank tests, i.e. generation and propagation of the focused wave events in isolation, without the structure present, and; static equilibrium tests, i.e. measurement of the membrane position/shape in equilibrium under the action of gravity (both submerged and subaerial). These test cases, and the experimental data, have been delivered as part of the Flexible Responsive Systems in Wave Energy (FlexWave) project [EP/V040367/1]
Experimental Set-up
The physical experiments were performed in the long ‘sediment’ flume in the COAST Laboratory at the University of
Plymouth, UK. The flume is 35m long and 0.6m wide with a porous ‘beach’ at the downstream end. Waves are generated
using
a single wet-backed, piston wave maker (‘absorbing piston paddle’, 0.5m by 1.0m by Edinburgh Designs Ltd.). The
water
depth for the experiments was set to 0.7m (Figure 1).
The global coordinate system is defined with the z-axis running vertically (positive upwards) with z = 0
corresponding
to the still water level. The x-axis runs in the direction of wave propagation (from the wave maker to the beach).
The
y-axis is defined according to the right-hand rule. The origin of the global coordinate system is located on the
front
face of the wave maker when at rest (19.36m upstream of the front edge of the membrane) on the centreline of the
flume
(Figure 1).
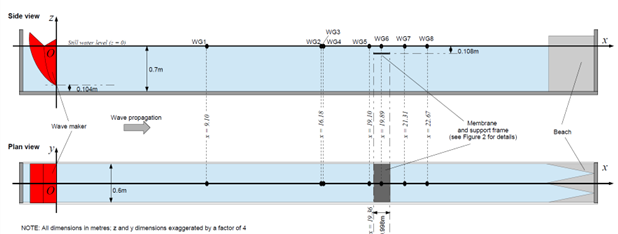
and definition of global coordinate system
Experimental layout (incl. wave gauges)
The experimental layout, incl. the wave gauge (WG) positions, is presented in Figure 1. The locations of the wave
gauges (WG) (in the global coordinate system) are indicated by black circles and summarised in Table 1
| WG1 | WG2 | WG3 | WG4 | WG5 | WG6 | WG7 | WG8 | |
| x coordinate | 9.10 | 16.18 | 16.23 | 16.36 | 19.10 | 19.89 | 21.31 | 22.67 |
| y coordinate | 0 | 0 | 0 | 0 | 0 | 0 | 0 | 0 |
Membrane (and support frame)
Figure 1 shows the position of the membrane (and support frame) in the wave flume. The membrane is 0.998m long,
0.594m wide and 3mm thick (when unloaded). The membrane is clamped on all four sides using a bolted aluminium
‘sandwich’ frame. The details of the support frame are given below, however, due to the complexity of the experiment
it is deemed acceptable for participants to assume the frame is rigid, even though this is not strictly true, and
any discrepancies will be discussed in the analysis of the results. If participants would like to attempt to model
the structural response of the support frame, as well as the membrane, we would be interested to receive results
from simulations with both a rigid and with a flexible support frame if possible.
The aluminium frame beneath the membrane consists of 3mm thick, 998mm long, 13mm x 9mm angle section down the sides,
welded to 568mm long, 20mm wide, 3mm thick flat bar running along the leading and trailing edges of the
membrane/frame. The membrane is then clamped/sandwiched in place with 588mm long, 20mm wide, 3mm thick flat bar on
the leading and trailing edges and 958mm long, 10mm wide, 3mm thick flat bar along the sides (Figure 2). This
aluminium frame is then held in place (bolted) at each corner via a 30mm x 30mm x 30mm x 3mm stainless steel bracket
and 30mm x 5mm stainless steel flat bar running vertically through the free-surface (Figure 2). The corners of the
aluminium frame are assumed to be held rigidly by the stainless brackets and upright sections. However, the rest of
the aluminium frame is relatively thin/flexible and cannot be assumed to be rigid.
The frame (and membrane) is positioned centrally in the flume (with a 3mm gap down each side), at a depth of 0.108m
(from free-surface to top surface of aluminium cross members) (Figure 2) and with the front edge located 19.36m from
the wave maker (when the membrane is in place WG6 is removed from the flume) (Figure 1).
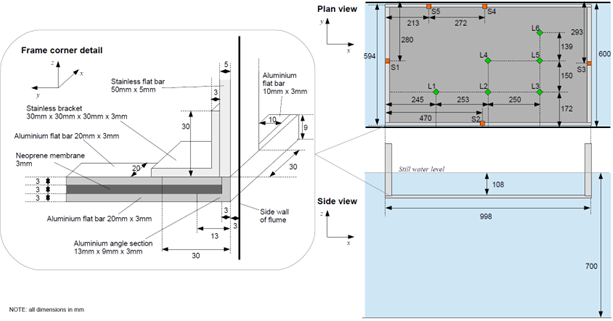
and position of laser distance measurements (L) and strain gauges (S)
Membrane deflection measurement
Figure 2 shows the positions of a series of membrane deflection measurements made using a laser distance sensor
(labelled with an ‘L’ and a green diamond) throughout the test cases (the positions are fixed in the global
coordinate system and summarised in Table 2).
| L1 | L2 | L3 | L4 | L5 | L6 | |
| x coordinate | 19.605 | 19.858 | 20.108 | 19.858 | 20.108 | 20.108 |
| y coordinate | -0.128 | -0.128 | -0.128 | 0.022 | 0.022 | 0.161 |
Support frame strain measurement
Figure 2 also shows the positions of a series of strain gauge sensors (labelled with an ‘S’ and an orange square)
used throughout the test cases. Each strain gauge position (S) indicates the position of a pair of strain gauges
(one on the upper piece/top face of the aluminium frame and one on the lower piece/bottom face of the aluminium
frame. The strain gauges are fixed to the aluminium support frame (in the middle of the frame element). The
positions of the strain gauges in the global coordinate system (when the frame is unloaded) are summarised in Table
3.
| S1 | S2 | S3 | S4 | S5 | |
| x coordinate | 19.37 | 19.83 | 20.348 | 19.845 | 19.573 |
| y coordinate | 0.02 | -0.289 | 0.007 | 0.289 | 0.289 |
| z coordinate (top position) | -0.108 | -0.108 | -0.108 | -0.108 | -0.108 |
| z coordinate (bottom position) | -0.117 | -0.117 | -0.117 | -0.117 | -0.117 |
Membrane material properties
The membrane in these cases is made of neoprene rubber.
The material is used for hovercraft ‘skirts’ and has additives such as carbon black or micro-ceramic powers to improve abrasion resistance. As a result, the density, and stiffness, of the material (see Table 4) are greater than that of typical neoprene. To obtain the material properties, samples of the membrane material were tested using two alternative procedures based on the standards for ‘Coated Fabric Tensile Testing’ (ASTM D751) and the ‘Standard Test Methods for Vulcanized Rubber and Thermoplastic Elastomers’ (ASTM D412). The properties of the membrane in the linear response region (up to a strain of 5 – 6.5%) are given in Table 4.
The properties of the membrane in the linear response region (up
to a strain of 6.5%) are given in Table 4. NOTE: we recommend the Young’s modulus value from the ASTM D412 test (Table 4) but, for completeness, the value from ASTM D751 is ~6.23MPa.
| Value | |
| Rest length [m] | 0.998 |
| Rest width [m] | 0.594 |
| Rest thickness [m] | 0.003 |
| Material density [kg/m3] | 1500 |
| Stiffness [N/m] | 4676.92308 |
| Young’s modulus [MPa] (ASTM D412) | 5.9 |
| Poisson’s ratio | 0.4884 |
To provide more information regarding the properties of the membrane and enable calibration of the numerical models.
The position/shape of the membrane has been measure when in static equilibrium (both in air and when submerged).
Table 5 gives the vertical position, in the global coordinate system, of the top surface of the membrane at each of
the laser distance sensor positions in Figure 2.
| L1 | L2 | L3 | L4 | L5 | L6 | |
| z coordinate of membrane top surface (in air)[mm] | -135 ± 2 | -141 ± 3 | -139 ± 2 | -151 ± 2 | -143 ± 2 | -131 ± 2 |
| Deflection from perfectly horizontal membrane (in air)[mm] | -24 ± 2 | -30 ± 3 | -28 ± 2 | -40 ± 2 | -32 ± 2 | -20 ± 2 |
| z coordinate of membrane top surface (underwater)[mm] | -127 ± 2 | -132 ± 1 | -131 ± 1 | -143 ± 3 | -133 ± 3 | -114 ± 6 |
| Deflection from perfectly horizontal membrane (underwater)[mm] | -16 ± 2 | -21 ± 1 | -20 ± 1 | -32 ± 3 | -22 ± 3 | -3 ± 6 |
Parameters used for wave generation
The waves, in each of the three blind test cases, are all generated using the EDL wave synthesiser and paddle control
software. The displacement of the paddle is calculated using linear wave maker theory. 228 ‘fronts’ (components) evenly
spaced between frequencies of 0.1 and 1.99167Hz (spacing = 0.025/3 Hz) are supply to the paddle control software based
on a theoretical wave description. In these cases, the theoretical wave descriptions are all crest-focused (i.e. zero
phase at focus location at focus time, \(\varphi_{focus}\)) NewWaves
based on a JONSWAP spectrum (γ = 3.3) with a peak period, \(T_p\) = 1.4s, a theoretical
focus time, \(t_{focus}\) = 45s, and
a theoretical focus location, \(x_{focus}\) = 19.9m upstream of the wave maker. The
three wave
definitions differ only by significant wave height, \(H_s\), and the crest amplitude, Acr, which is given by
\(A_{cr} = \sqrt{2m_0\ln1000}\), where \(m_0\) is the zeroth spectral moment and can be
approximated according to \(m_0 = \left(\frac{H_s}{4}\right)^2\). Table 6 summarises
the theoretical parameters in the wave descriptions used for wave generation in each of the three focused wave cases 1CS2,
2CS2 and 3CS2. A file containing the parameters describing the 228 fronts in each case (e.g. 1CS2_fronts.txt) can be
found in the ‘Resources’ section below.
| 1CS2 | 2CS2 | 3CS2 | |
| Water depth [m] | 0.7 | 0.7 | 0.7 |
| Theoretical peak period, \(T_p\) [s] | 1.4 | 1.4 | 1.4 |
| Theoretical significant wave height, \(H_s\) [m] | 0.015 | 0.03 | 0.04 |
| Theoretical crest elevation, \(A_{cr}\) [m] | 0.01394 | 0.02788 | 0.03717 |
| Theoretical focus location, \(x_{focus}\) [m] | 19.9 | 19.9 | 19.9 |
| Theoretical focus time, \(t_{focus}\) [s] | 45 | 45 | 45 |
| Theoretical focus phase, \(\varphi_{focus}\) [°] | 0 | 0 | 0 |
In addition, for each of the test cases, the physical surface elevation measurements from an ‘empty tank’ test are
supplied in the ‘Resources’ section (e.g. 1CS2_empty.txt) to enable participants to compare the accuracy of the wave
generation/propagation in their models before adding the structure.
Physical Measurement Data
The CCP-WSI Comparative Study 2 (formerly the CCP-WSI Blind Test Series 4) is now an ‘open’ comparative study for validation of numerical WSI codes. Consequently, all the physical data has now been released to the participants. This includes:
- the ‘calibration’ data released to participants of the CCP-WSI Blind Test Series 4, i.e.:
- the surface elevation data from the wave gauges in the empty tank tests (see Figure 2 and Table 1 for the wave gauge positions) [available in the Resources section], and;
- the deflection of the membrane in static equilibrium (see Figure 2 and Table 2 for position of membrane deflection measurements).
(which were originally believed, to be sufficient to reproduce the incident waves in each of the focused wave cases with the membrane in place as well as to calibrate the material properties of the membrane);
- new material property data (released to support the CCP-WSI Comparative Study 2 following the transition from the CCP-WSI Blind Test Series 4), and;
- the data from the focused wave cases with the membrane in place can be found at [add link].
Blind Test
Submission Procedure
To participate in the CCP-WSI Comparative Study 2 we kindly ask participants to submit their simulation data based on
the following submission procedure.
Schedule (subject to change)
The CCP-WSI Comparative Study 2 is being run by the CCP-WSI independently. The findings of the Study will be presented at a CCP-WSI workshop (tbc). It is our intention to then produce a special edition journal (tbc) with the papers corresponding to the individual contributions from the participants and a main paper detailing the main findings from the Comparative Study. Please note, all participants in the Study (with eligible submissions of data) will be included as co-authors on the main paper (irrespective of individual contribution to the special edition journal). The schedule CCP-WSI Comparative Study 2 is as follows:
| 24th Nov. 2023 | Release of the CCP-WSI Comparative Study 2 description |
| 28th Mar. 2024 | Deadline for submission of numerical solutions to the Comparative Study |
| Date tbc | CCP-WSI Comparative Study 2 workshop |
| Data tbc | (proposed) Submission of papers to special edition journal (tbc) |
| Date tbc | (proposed) Final submission of papers to special edition journal (tbc) |
Empty tank simulation
It is requested that, for each test case/wave case, a corresponding empty tank simulation is also conducted (with a
numerical mesh equivalent to that used in the wave cases with the structure included) and the data submitted as
part of the Comparative Study. NOTE: Please remember that the physical measurements from corresponding empty tank
experiments are available in the ‘Resource’ section.
For the empty tank submissions, it is requested that time series data be submitted for surface elevation recorded at
the positions of wave gauges 1-8 (see Figure 1/Table1 for WG positions). For each empty tank case please submit:
- A single, tab-delimited text file:
- filename: {caseID}_empty_{institution} (e.g. 1CS2_empty_Plymouth) (NOTE: if you have multiple institutions, please separate with hyphens, e.g. 1CS2_empty_Plymouth-STFC)
- column 1: Time (in secs relative to beginning of empty tank data, i.e. 0 – 64s)
- columns 2-9: Surface elevation measurements (in metres)
- WG 1, 2, 3, 4, 5, 6, 7, 8
Membrane equilibrium position
It is also requested that the static equilibrium position of the membrane be calculated, both in air and when
submerged, and the deflection (from horizontal) be submitted as part of the Comparative Study. NOTE: Please remember that
the physical measurements from corresponding membrane equilibrium tests are available in given in Table 5.
For the membrane equilibrium position submission, it is requested that the z-component of the top surface of the
membrane, in the global coordinate system (Figure 1), be calculated at each of the laser sensor positions (L) in
Figure 2/Table 2 as well as at the additional positions (A) in Figure 3/Table 7.
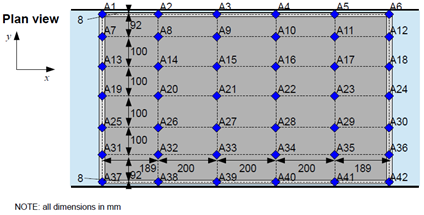
| x coordinate [m] | |||||||
| 19.37 | 19.559 | 19.759 | 19.959 | 20.159 | 20.348 | ||
| y coordinate[m] | 0.292 | A1 | A2 | A3 | A4 | A5 | A6 |
| 0.200 | A7 | A8 | A9 | A10 | A11 | A12 | |
| 0.100 | A13 | A14 | A15 | A16 | A17 | A18 | |
| 0.00 | A19 | A20 | A21 | A22 | A23 | A24 | |
| -0.100 | A25 | A26 | A27 | A28 | A29 | A30 | |
| -0.200 | A31 | A32 | A33 | A34 | A35 | A36 | |
| -0.292 | A37 | A38 | A39 | A40 | A41 | A42 | |
For the membrane equilibrium position please submit:
- A single, tab-delimited text file:
- filename: 0CS2_membrane_{institution} (e.g. 0CS2_membrane_Plymouth)
- row 1: Results from when membrane has reached equilibrium in air
- row 2: Results from when submerged membrane has reached equilibrium
- columns 1-6: vertical coordinate/z-position of top surface of membrane/frame, in global coordinate system,
in metres at locations L1-6 - columns 7-48: vertical coordinate/z-position of top surface of membrane/frame, in global coordinate system,
in metres at locations A1-42
Focused wave cases (incl. membrane)
For the focused wave cases including the membrane/frame, it is requested that time series data be
submitted according to the following:
- A single, tab-delimited text file:
- filename: {caseID}_full_{institution} (e.g. 1CS2_ full_Plymouth)
- column 1: Time (in secs relative to beginning of empty tank data, i.e. 0 – 64s)
- columns 2-9: Surface elevation measurements (in metres)
- WG 1, 2, 3, 4, 5, 6, 7, 8
- columns 9-15: vertical coordinate/z-position of top surface of membrane/frame, in global coordinate system,
in metres at locations L1-6 - columns 15-57: vertical coordinate/z-position of top surface of membrane/frame, in global coordinate system,
in metres at locations A1-42
Resources
Accompanying documents
| Filename | Description |
|---|---|
| 1CS2_fronts.txt |
Wave fronts supplied to wave maker for wave generation in 1CS2 (and 1CS2_empty); tab-delimited text file (lines 1-3 – headers; column 1 – frequency (Hz); column 2 – amplitude (m); column 3 – angle (rad); column 4 – phase (rad) |
| 2CS2_fronts.txt |
Wave fronts supplied to wave maker for wave generation in 2CS2 (and 2CS2_empty); tab-delimited text file (lines 1-3 – headers; column 1 – frequency (Hz); column 2 – amplitude (m); column 3 – angle (rad); column 4 – phase (rad) |
| 3CS2_fronts.txt |
Wave fronts supplied to wave maker for wave generation in 3CS2 (and 3CS2_empty); tab-delimited text file (lines 1-3 – headers; column 1 – frequency (Hz); column 2 – amplitude (m); column 3 – angle (rad); column 4 – phase (rad) |
| 1CS2_empty.txt |
Empty tank test surface elevation data for 1CS2 wave case (1CS2_empty); tab-delimited text file (line 1 – header; column 1 – Time (s); columns 2-9 – surface elevation at wave gauges WG1-WG8 (m)) |
| 2CS2_empty.txt |
Empty tank test surface elevation data for 2CS2 wave case (2CS2_empty); tab-delimited text file (line 1 – header; column 1 – Time (s); columns 2-9 – surface elevation at wave gauges WG1-WG8 (m)) |
| 3CS2_empty.txt |
Empty tank test surface elevation data for 3CS2 wave case (3CS2_empty); tab-delimited text file (line 1 – header; column 1 – Time (s); columns 2-9 – surface elevation at wave gauges WG1-WG8 (m)) |
Relevant References
The details, and all corresponding physical data, for the CCP-WSI Comparative Study 2 are published by the University of Plymouth and deposited in the University of Plymouth Research Repository (under embargo until completion of the CCP-WSI Comparative Study 2) with the citation and doi:
We request that this, as well as the citation for the main comparative paper for the study (tbc), be used as the source of the test case description and physical data.
Other relevant references include:
Publications associated with the CCP-WSI Blind Test Series 4:
-
Liu, W., Mahfoze, O. A., Longshaw, S. M., Emerson, D. R. (2023), CCP-WSI Blind Test Series 4 – Simulation of Focused Wave Interactions with a Submerged Flexible
Membrane using the ParaSiF Framework, in Proceedings of the Thirty-third International Ocean and Polar Engineering Conference, June 19-23, 2023, Ottawa, Canada - Zhang, N., Yan, S., Ma, Q., Zhang, Y., Zheng, X., (2023), A numerical study on focused wave interactions with a submerged flexible membrane using SPH, in Proceedings of the Thirty-third International Ocean and Polar Engineering Conference, June 19-23, 2023, Ottawa, Canada
Publications associated with the FlexWave project’s experimental campaign:
- Puzhukkil, K., Wang, X., Yang, J., Borthwick, A., Ransley, E., Chaplin, J., Cox, M., Meng, M., Hann, M., Rawlinson-Smith, R., Zheng, S., Cheng, S., You, Z., Greaves, D. (2023), ‘Hydro-elastic interaction of polymer materials with regular waves’, in Proceedings of the 15th European Wave and Tidal Energy Conference (EWTEC), 3-7 September 2023, Bilbao, Spain